57% urban Indians prefer ayurvedic shampoo over international brands
52 per cent still prefer cash only to pay for their purchases in the stores
PRASHNAM INSIGHT #30
The Print and Prashnam surveyed urban Indians in Bihar, Gujarat, Kerala, Madhya Pradesh, Maharashtra, Rajasthan, Tamil Nadu, Uttar Pradesh and West Bengal
Indian consumer goods market is abundant with choices for the consumers. The share of Ayurvedic products have increased considerably over the years and now stand as a solid alternative to conventional cosmetic products. Has the increasing shift of young Indians towards Ayurvedic products for real? Do they opt for an Ayurvedic product to a branded one if offered at the same price? Also, what payment methods do they adopt especially in lockdowns due to the ongoing pandemic. These are the questions Prashnam decided to ask the urban Indians this week.
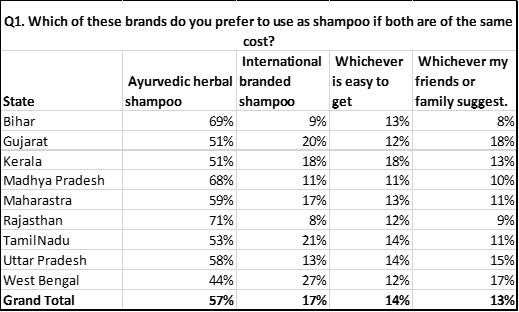
Which of these brands do you prefer to use as shampoo if both have the same cost?
Ayurvedic herbal shampoo
International branded shampoo
Whichever is easy to get
Whichever my friends or family suggest.
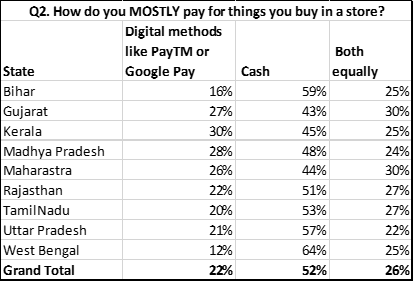
How do you MOSTLY pay for things you buy in a store?
Digital payment like PayTM or Google Pay
Cash
Both equally
57 % prefer Ayurvedic shampoo over an internationally branded one.
A significant majority of urban Indians (57 per cent) preferred an ayurvedic herbal shampoo over an international branded shampoo. 65 per cent in Hindi speaking states compared to 52 per cent in other states.
Cash is still the most preferred form of payment.
52 per cent of the respondents prefer to pay in cash but at the same time, there also seems to be a shift to modern digital modes of payment for purchases. But more than 30 per cent prefer to pay digitally which is a significant shift towards cashless transactions.
Respondent profile
2733 adult Indians responded to this survey. They were from 9 states - Bihar, Gujarat, Kerala, Madhya Pradesh, Maharashtra, Rajasthan, Tamil Nadu, Uttar Pradesh and West Bengal, belonging to 108 districts. 66 per cent were male and 34 per cent female. 67 per cent were youth (<40 years), 28 per cent middle-aged and 5 per cent seniors (>60).
Read the full report in The Print here
The raw response data is available here.


